All software
nanomesh
Python workflow tool for generating meshes from 2D and 3D microscopy image data
- Image processing
- Visualization
- Workflow technologies
- Jupyter Notebook
- PowerShell
- Python
- + 1
eEcology Annotation Tool
Visualize and annotate GPS measurements of bird movements.
- Inter-operability & linked data
- Visualization
- API Blueprint
- CSS
- Dockerfile
- + 5

SedTRAILS
SedTRAILS is a Lagrangian particle-tracking model for simulating and visualizing coastal sediment pathways and connectivity. Initial public release forthcoming ~February 2026.
- Coastal Engineering
- coastal processes
- connectivity
- + 5
- Python

3D Slicer
3D Slicer is a free, open source software for visualization, processing, segmentation, registration, and analysis of medical, biomedical, and other 3D images and meshes; and planning and navigating image-guided procedures.
- 3D
- 3DSlicer
- Extension
- + 7
- C
- C++
- CMake
- + 6
MagnumPI - Potential Integrator
A package for the calculation of scattering angles and cross sections.
- Inter-operability & linked data
- Visualization
- C++
- CMake
- M4Sugar
- + 2
PIQMIe
A web tool for mass spectrometry-based proteomics data analyses
- Data Analysis
- mass spectrometry
- Optimized data handling
- + 2
- Dockerfile
- HTML
- JavaScript
- + 3
gemdat
a Generalized Molecular Dynamics Analysis Tool
- analysis
- molecular dynamics
- python
- + 1
- Python
Introduction to Geospatial Raster and Vector Data with Python
This lesson material shows how practical geospatial data analysis tasks can be carried out using Python
- Data Analysis
- geospatial
- Image processing
- + 4
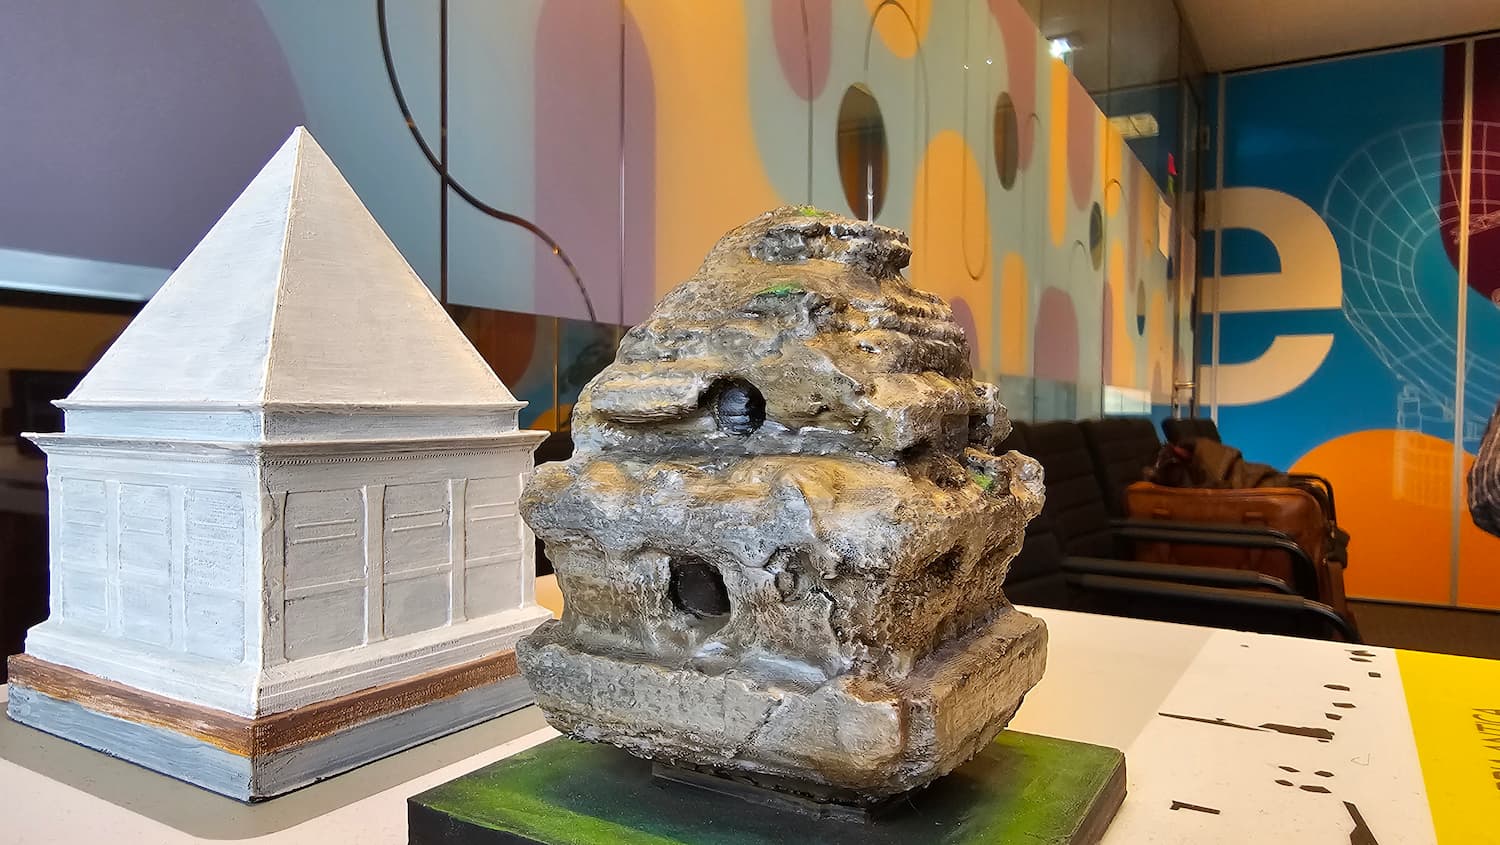
Revisited Via Appia
Create visual storylines that involve media like images and videos embedded in a 3D environment with efficient Pointcloud data directly from the web browser.
- cultural heritage
- Digital Twins
- gis
- + 2
- CSS
- HTML
- JavaScript
- + 3

adhtools
Use adhtools for analyzing Arabic corpora.
- Text analysis & natural language processing
- Visualization
- Workflow technologies
- Common Workflow Language
- Java
- Jupyter Notebook
- + 1

Data Storytelling
Developing consistent, structured ways to present data across projects. Using LLMs and interactive tools to turn results into clear, engaging stories. Applying this approach to selected eScience projects, especially those in the upcoming center-wide evaluation.
- application
- llm
- storytelling
- + 1
- CSS
- HTML
- JavaScript
- + 3
eEcology Tracker calendar
Calendar overview with daily statistics of GPS-trackers used to track bird movements.
- Visualization
- CSS
- JavaScript
- Makefile
- + 5